
What’s Trending? – Identifying Up Trends and Down Trends
One of the keys to success for trend traders is finding out what’s trending in the markets. In the forex world, our currency pair is
ProSticks (Bonus Intro) – Technical Analysis Methods
ProSticks are the latest format when it comes to charting visuals. The evolution of charts didn’t end with candlesticks, just as the evolution of cell
How Long Does it Take to Make Candles? – Technical Analysis
In my previous piece I introduced candlestick charts. Now you might be asking, how long does it take to make candles? Here is the good
What Do Colored Candlesticks Mean? – Technical Chart Analysis
What do colored candlesticks mean on trading charts? We basically use two different colors to distinguish candles that are bearish from candles that are bullish.
Candle Charts – Technical Analysis with Candlesticks
Candle charts were the next generation trading platform visuals after bar charts. Bar Charts were popular for a while, but just like our phones need
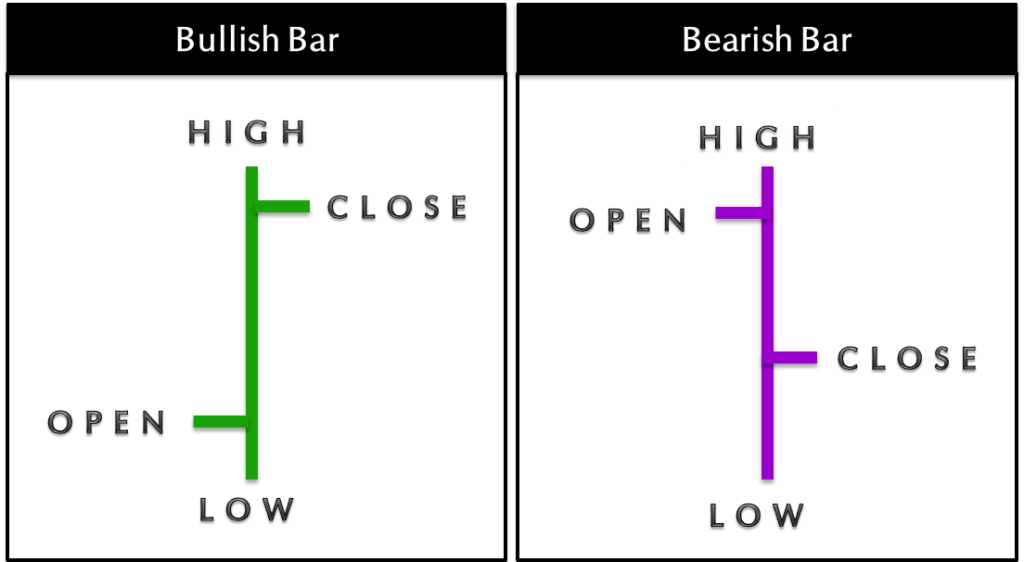
Bar Charts – Technical Analysis with Candlesticks
The bar charts were invented after line charts. The nosy and geeky traders were dying of curiosity and wanted to visually see where the currency
Line Charts – Technical Analysis with Candlesticks
Ancient traders (from the past decades) did their technical analysis mostly on Line Charts, which look pretty boring comparing to the modern charts. Line Charts
Relative Strength Index (RSI) – Momentum Indicator
The relative strength index, or RSI, is yet another momentum indicator, or oscillator, that measures the relative internal strength of the currency pair against itself.
Mr. Fibonacci (Part 2) – How to Use Fibonacci Levels in Forex Trading
In the previous piece, I talked about how Fibonacci levels came about. Now let’s show you how you can apply the Fibonacci levels to your