Bar Charts – Technical Analysis with Candlesticks

https://www.youtube.com/watch?v=RghwgzNgZ64

The bar charts were invented after line charts. The nosy and geeky traders were dying of curiosity and wanted to visually see where the currency pair is moving during a specific time periods, especially longer periods such as hourly, 4-hour, daily or monthly. They could of course set their charts to 1-minute to see the most recent movements, but by doing that, they would miss out on the general view on the market. If only there was a way to know what prices the pair covered during a specific period of time…


The Invention of Bar Charts

This led to invention of the second generation charts: the Bar Charts. Bar charts are more informative compared to Line Charts because they display not only the closing prices but the open, high, and low prices as well.

FREE MasterClass: Take Control of Your Financial Future >>

In other words, by keeping an eye on a Bar Chart, you can know that in a given time period where in the forex dance floor (aka platform) the pair started dancing, where they dipped, where they jumped, and where they ended the round. Now this may not be useful at all if you were just watching a couple dancing Argentine tango, but in forex trading, it can reveal many useful secrets. Here is what a bar looks like (Not to be confused with a chocolate bar, legal bar exam, or a retail establishment that serves alcoholic beverages.)

Bar Charts - Open, High, Low, Close 
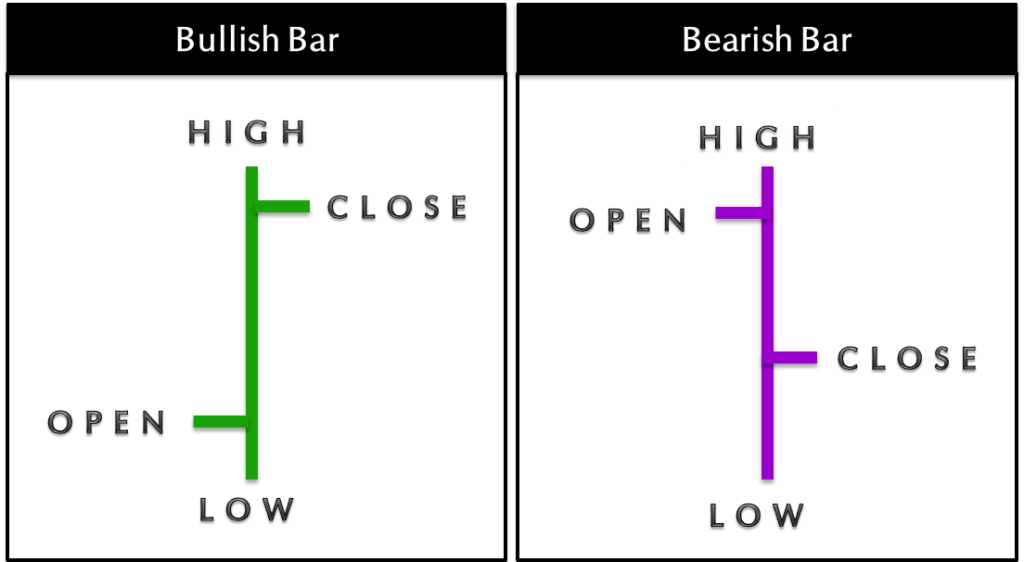
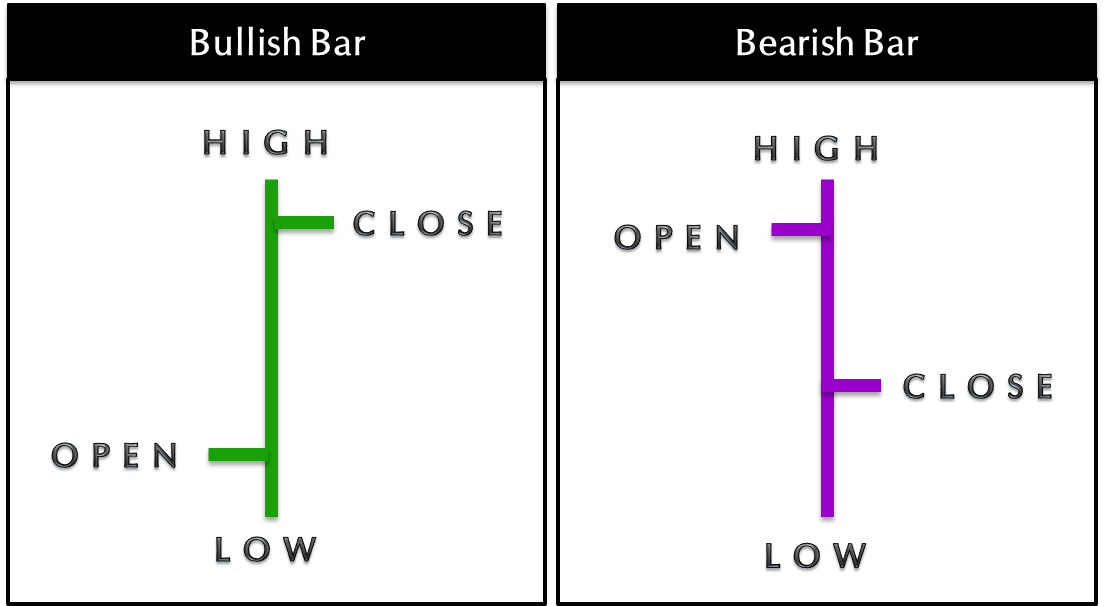
Bar Charts Show Open, High, Low, Close Prices

Open: The little horizontal line to the left is aligned with the open price at a given time period

High: The top of the vertical line shows the highest price in that time period

Low: The bottom of the vertical line is the lowest price of the time period

Close: The little horizontal line to the right is the last price or the closing point of the time period

This is how Bars are shown in action on the forex dance floor:
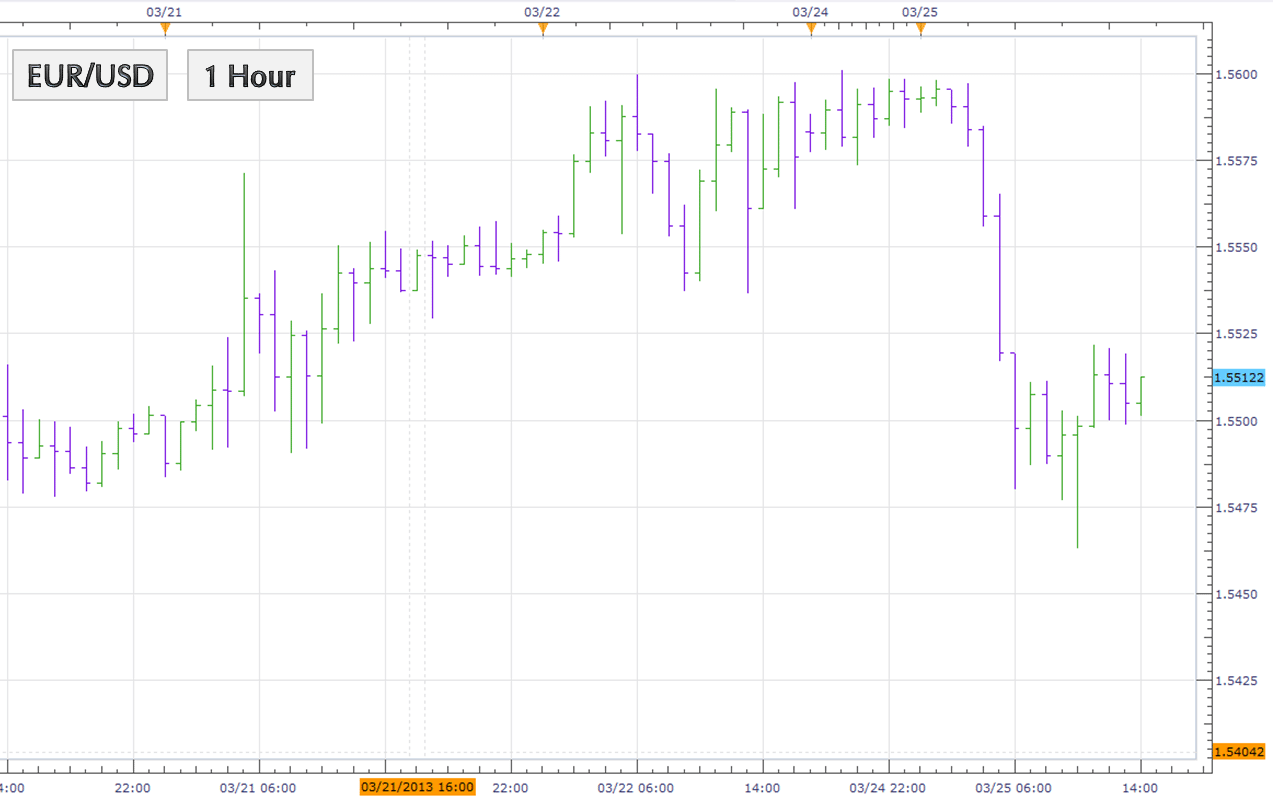
Bar Charts Example Bar Charts Example

In the hourly bar chart above, it takes one hour to form one bar. Each bar displays the open, high, low and close prices for that hour.

3 Secrets to Take Control of Your Financial Future >>

Related:

CrowdStrike Stock (CRWD): The Move No One Is Talking About But Everyone Should Watch

CrowdStrike is one of the biggest names in cybersecurity. They protect computers, cloud systems, and now even AI models. The company keeps growing fast, keeps making moves with giants like Nvidia and Google, and keeps expanding its platform into places most investors are not watching yet.

That is why this blog exists. There is a lot happening behind the scenes with CrowdStrike. Some of it is obvious. Some of it is quiet. Some of it could shape the future of the stock in bigger ways than the headlines show.

Read More »

Nvidia (NVDA) $5 Trillion Milestone Is Still Shaking Up Wall Street – Is This The Peak Of The AI Boom Or Just The Beginning?

After a period of unstoppable momentum, Nvidia (NVDA) is once again dominating headlines – and it’s no wonder Wall Street can’t look away. Once known primarily for gaming graphics, Nvidia has transformed itself into the beating heart of the AI revolution.

Its playbook, centered on innovation, scale, and ecosystem control, has turned the company into one of the most valuable and influential forces in tech history. But as investors cheer its meteoric rise, the question now looms: is Nvidia reaching new heights of sustainable growth, or is it flying too close to the sun?

Read More »

Netflix Stock (NFLX): Exciting 10:1 Split. Not-So-Exciting Earnings. What’s Under The Surface?

Netflix is one of the most recognizable companies in the world. It has a massive audience, strong brand awareness, and a long history of reshaping how we watch TV. Recently, Netflix announced a 10:1 stock split. A split does not change the value of the company, but it lowers the price per share and often makes the stock feel more accessible to everyday investors.

Read More »

Beyond Meat Stock (BYND) $900 Million Debt Deal News: Lifeline Or Last Gasp Before Collapse?

After months of steep declines and fleeting meme-fueled rallies, Beyond Meat (BYND) is once again in the spotlight – this time for its massive $900 million debt-for-equity deal. Once celebrated as the face of plant-based innovation, the company now finds itself fighting for survival amid collapsing sales, widening losses, and a heavily diluted shareholder base.

Read More »

Ferrari Stock (RACE) Plunged Hard. Is It A Short-Term Drop Or A Long-Term Decline?

Ferrari. A name that evokes speed, luxury, and precision.
But lately, its stock has been running into some rough turns.

After hitting record highs earlier this year, Ferrari’s share price took a sharp dive following its Capital Markets Day. Investors were caught off guard. Expectations were sky-high, and the company’s updated targets didn’t quite match the market’s adrenaline.

Read More »